IELTS Writing Task 1 (Academic): A Real Band 7.0 Sample, Graded by Cuepen
A full Task 1 Academic answer to the classic CO₂ emissions line graph — scored band-by-band by Cuepen's AI examiner, with the exact fixes that lift it toward Band 8.
Question:
The graph below shows average carbon dioxide (CO₂) emissions per person in the United Kingdom, Sweden, Italy and Portugal between 1967 and 2007. Summarise the information by selecting and reporting the main features, and make comparisons where relevant.
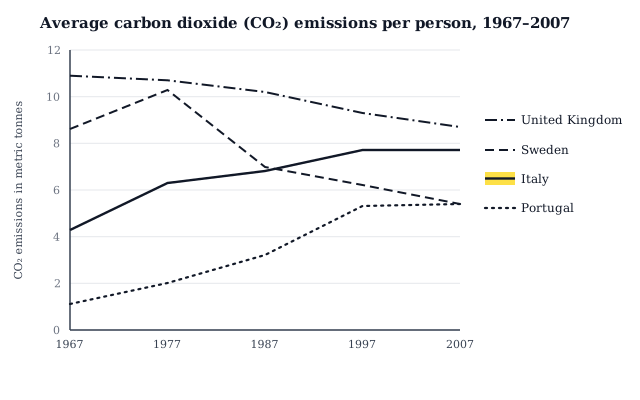
| Country | 1967 | 2007 | Trend |
|---|---|---|---|
| United Kingdom | ~10.9 | ~9.0 | Steady decline (highest throughout) |
| Sweden | ~9.0 | ~5.5 | Rose to ~10.5 peak (1977), then fell sharply |
| Italy | ~4.5 | ~8.0 | Gradual rise, then flat |
| Portugal | ~1.2 | ~5.5 | Lowest start, largest increase |
Values in metric tonnes of CO₂ per person.
Candidate's answer:
The line graph below illustrates the average CO2 emissions per person in four different countries UK, Sweden, Italy and Portugal between the years 1967 and 2007.
Overall, carbon dioxide emissions in Italy and Portugal increased over the period, whereas the United Kingdom showed a steady decline until the end of the period. In contrast, Sweden's emissions rose slightly at the beginning before experiencing a dramatic decrease over the remainder of the period.
The carbon dioxide emissions in Portugal rose steadily from 1 tonne in 1967 to around 5 tonnes in 2007. Similarly, Italy experienced a continuous increase from 4 tonnes in 1967 to just below 8 tonnes after which it remained relatively stable until the end of the period.
The United Kingdom had the highest emissions at the start with approximately 11 tonnes in 1967, then declined gradually to around 9 tonnes in 2007, although it remained the highest overall. In contrast, Sweden's emissions peaked at 11 tonnes in 1977, before experiencing a dramatic decrease to roughly 6 tonnes by the end of the period, reaching the same level as Portugal in 2007.
Full Cuepen report:
This is the complete assessment, exactly as the model returned it. Click a criterion card to filter the line-by-line view, or any flagged sentence for its feedback.
Candidate's Answer
Task Achievement feedback (3)
The carbon dioxide emissions in Portugal rose steadily from 1 tonne in 1967 to around 5 tonnes in 2007.
💡Portugal started at about 1.2 tonnes, not exactly 1
The carbon dioxide emissions in Portugal rose steadily from around 1.2 tonnes in 1967 to about 5.5 tonnes in 2007.
Similarly, Italy experienced a continuous increase from 4 tonnes in 1967 to just below 8 tonnes after which it remained relatively stable until the end of the period.
💡Italy began nearer 4.5 tonnes, not 4
Similarly, Italy experienced a continuous increase from around 4.5 tonnes in 1967 to just below 8 tonnes, after which it remained relatively stable until the end of the period.
In contrast, Sweden's emissions peaked at 11 tonnes in 1977, before experiencing a dramatic decrease to roughly 6 tonnes by the end of the period, reaching the same level as Portugal in 2007.
💡Sweden peaked closer to 10.5, not 11, tonnes
...Sweden's emissions peaked at around 10.5 tonnes in 1977, before experiencing a dramatic decrease to roughly 5.5 tonnes by the end of the period.
The fastest route to 7.5+
- Use precise figures: 1.2 / 4.5 / 10.5 / 5.5 — not rounded whole numbers (3 data-accuracy slips capped Task Achievement at 7).
- Cut repetition of "period" (×6), "emissions" (×5) and "dramatic decrease" (×2).
- Tighten punctuation around subordinate and relative clauses, and add a brief closing sentence — the report flags no conclusion.
Frequently asked questions
What band is this IELTS Task 1 line graph answer?+
It scores Band 7.0 overall — Task Achievement, Coherence & Cohesion, Lexical Resource and Grammatical Range each at Band 7.
How do I get Band 8 in IELTS Task 1?+
Report figures precisely (e.g. 1.2 not 1 tonne), vary repeated words like 'period' and 'emissions', and tighten punctuation around clauses.
How is this essay graded?+
Cuepen's AI examiner scores all four IELTS criteria and flags every sentence-level issue with a correction.
Get your essay graded like this
Cuepen scores your IELTS Writing against all four criteria and shows the exact fixes, line by line — in seconds.
Try Cuepen free