IELTS Writing Task 1 (Academic): A Band 8 Table Description, Graded
A Band 8 IELTS Academic Task 1 answer describing a table of children's educational problems in two schools — graded line by line by Cuepen's AI examiner across all four criteria.
Question:
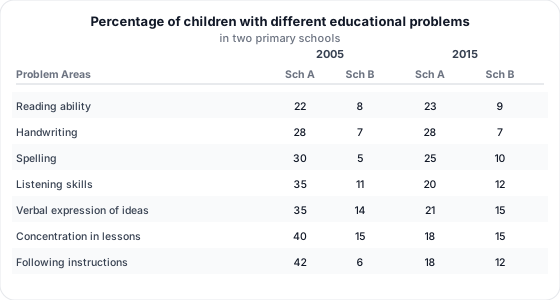
The table below gives information about the problems faced by children in two primary schools in 2005 and 2015. Summarise the information by selecting and reporting the main features, and make comparisons where relevant. Write at least 150 words.
Candidate's answer:
The table provides information about seven different educational problems faced by children in two primary schools, labelled School A and School B. The data is given for two separate years, 2005 and 2015, and is shown as percentages of children experiencing each difficulty.
Overall, the most noticeable trend is that School A saw a significant drop in many of its problem areas over the ten-year period, while School B's situation remained more stable or even worsened slightly in some categories. In 2005, School A had much higher percentages of problems than School B in almost every area, but by 2015, this gap had become much smaller.
Looking at the figures for School A, in 2005 a very high number of children had problems with following instructions (42%) and concentration (40%). These were the two biggest issues for the school. However, by 2015, these figures had fallen dramatically to just 18% for both areas. Similarly, problems with listening skills and verbal expression both dropped from 35% in 2005 to around 20% in 2015. While most areas improved, the percentage for reading ability stayed almost the same, rising slightly from 22% to 23%.
For School B, the situation was quite different. The percentages in 2005 were much lower than School A's in all categories, with spelling (5%) and following instructions (6%) being the least common problems. By 2015, some of these figures had increased a little. For example, the number of children with spelling problems doubled from 5% to 10%, and following instructions also rose from 6% to 12%. Other areas, like reading, handwriting, and concentration, remained almost exactly the same over the ten years.
Full Cuepen report:
This is the complete assessment, exactly as the model returned it. Click a criterion card to filter the line-by-line view, or any flagged sentence for its feedback.
Candidate's Answer
Task Achievement feedback (1)
The percentages in 2005 were much lower than School A's in all categories, with spelling (5%) and following instructions (6%) being the least common problems.
💡Comparisons are accurate but the persisting School A/B gap in 2015 could be highlighted more skilfully for full development.
Despite these changes, School A still recorded higher percentages than School B in several 2015 categories, showing the gap narrowed rather than closed.
The fastest route to 8
- Replace vague quantifiers ('a little', 'much') and informal items ('biggest issues') with precise academic vocabulary.
- Excellent coverage. To reach Band 9, highlight one or two subtle secondary patterns (e.g. that some School A categories still exceed School B in 2015) with equal precision.
- Vary linking beyond and/similarly/however, and prefer 'such as' over 'like'.
- Keep the overview to the single biggest trend (School A fell sharply while School B barely moved) — the examiner rewards that up front.
Frequently asked questions
What band is this IELTS Academic Task 1 table answer?+
It scores an overall Band 8 — Task Achievement 8, Coherence & Cohesion 8, Lexical Resource 7 and Grammatical Range & Accuracy 9.
How do you describe a table in IELTS Task 1?+
Open with a one-sentence overview of the single biggest trend, then group the data logically — here, School A falling sharply while School B stayed broadly stable — and support each group with accurate figures and comparisons.
Get your essay graded like this
Cuepen scores your IELTS Writing against all four criteria and shows the exact fixes, line by line — in seconds.
Try Cuepen free